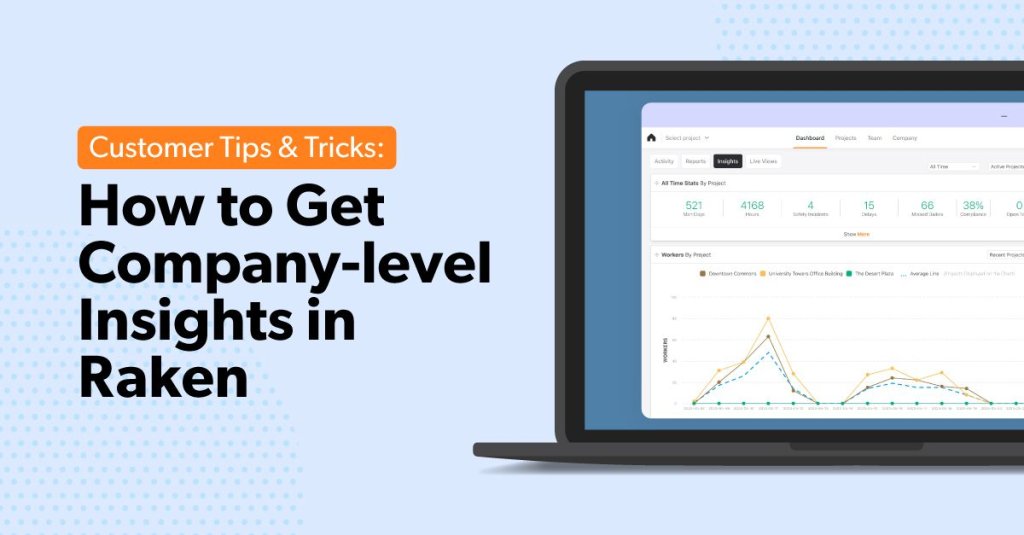
Raken automatically organizes all the project data you collect in a visual insights dashboard.
Different from the project-level dashboards within each individual project in Raken, this view shows you how your business is performing as a whole, instead of just on a per-project basis. Gain accurate, company-level insights to better measure performance on a daily, weekly, monthly, or yearly basis—or for any custom time frame.
Use the insights dashboard to better allocate resources, identify areas for improvement, and make more informed business planning decisions.
Where is the insights dashboard?
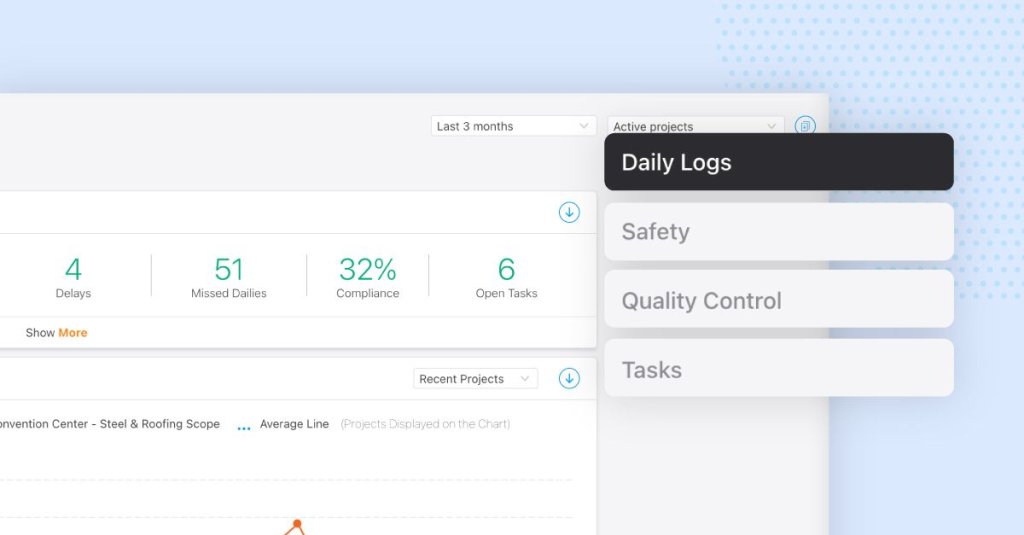
Log into Raken’s web app. Click the tab labeled Insights in the upper left corner of your screen.
Use the sidebar on the right to toggle between views for:
Daily logs - An overview of resources and reporting compliance across projects
Safety - Safety metrics, including top 5 checklist deficiencies and observations
Quality control - Quality control metrics, including top 5 checklist deficiencies and observations
Tasks - A view of all open tasks
How can I filter the data?
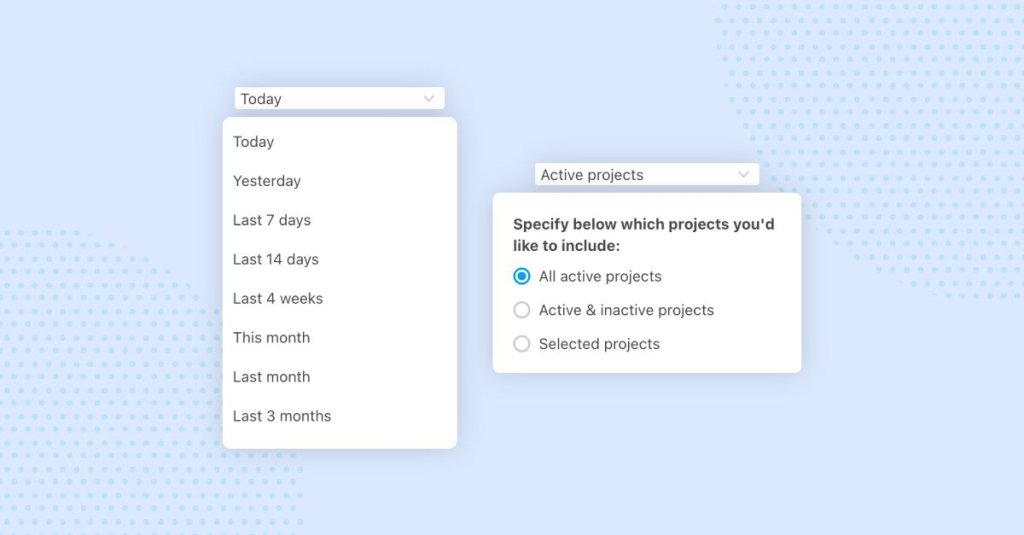
Filter results by time frame and project status using the drop down menus in the upper right. Set a custom time frame, or choose any of the provided options:
Today
Yesterday
Last 7 days
Last 14 days
Last 4 weeks
This month
Last month
Last 3 months
Last 6 months
Last 12 months
This year
Last year
All time
Then, choose to include data from only active or both active and inactive projects, or select specific projects by name.
Need to share your insights? Click the blue icon next to the dropdown menus to download your data in a shareable PDF report format.
What kind of data does Raken track?
The insights dashboard helps you track productivity and compliance.
Let’s take a closer look at each section.
Daily logs
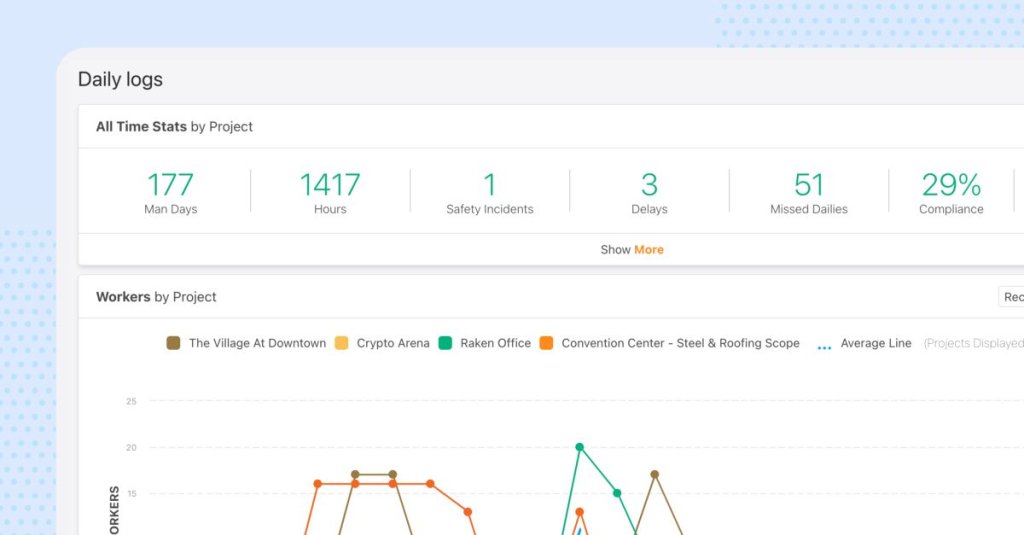
Select the daily logs view to see a breakdown of project performance and resource allocation. You’ll find:
Time stats - Review work hours, delays, safety incidents, and report compliance at a glance
Workers by project - See how many workers are currently assigned to each project
Top users - See how team members are using Raken
Compliance by subcontractor - Review report compliance by subcontractor
Hours by project - See how many work hours were logged for each project
Compliance by project - Review report compliance by project
Project delays - Track delays by date and project
Safety incidents - Track safety incidents by date and project
Safety
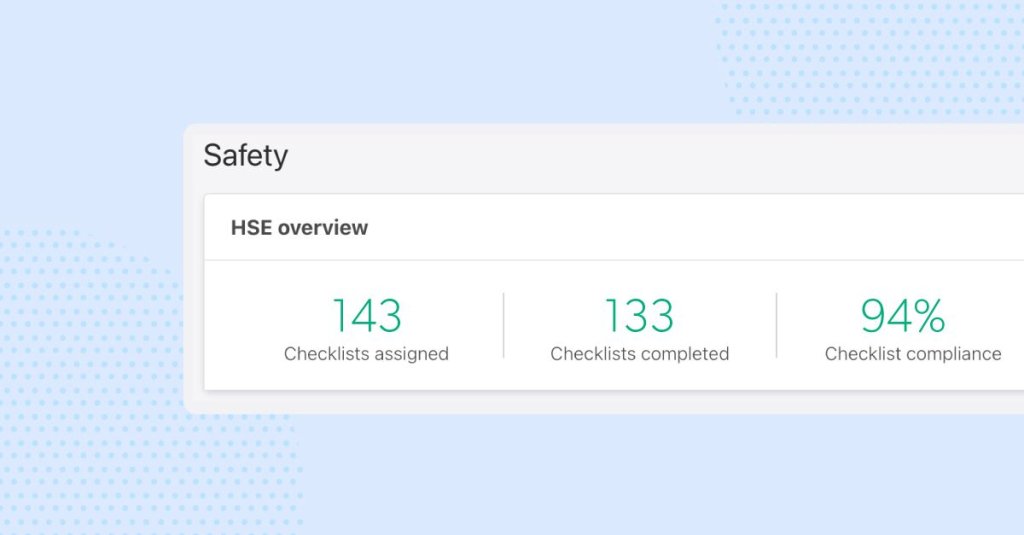
The safety view is a detailed look at safety statistics.
HSE overview
HSE checklist completion by work unit
Top 5 checklist deficiencies
HSE issues raised by type
HSE observations raised by team member
HSE issues observed / hours worked
Positive vs. negative HSE observations by company
Toolbox talks statistics
Quality control
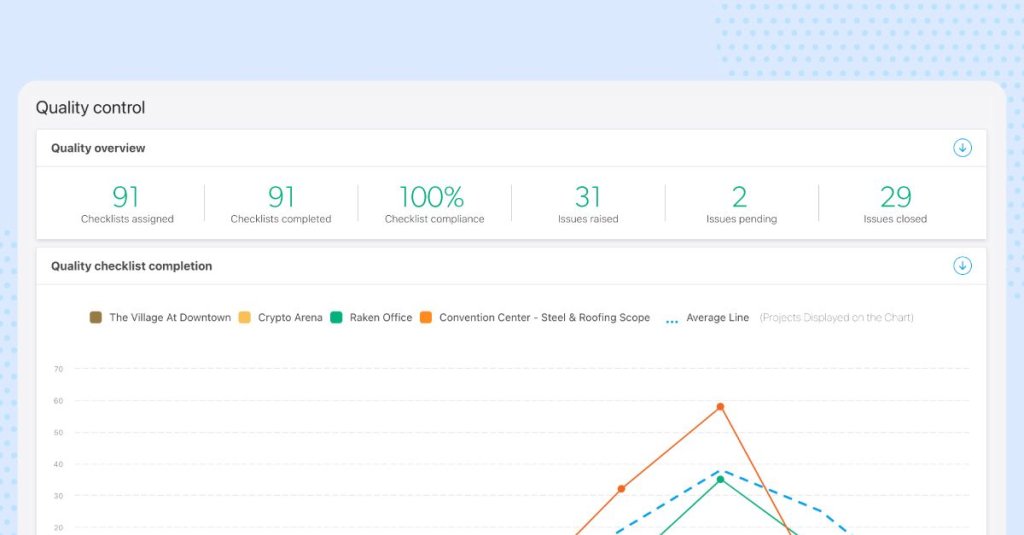
The quality control view is similar to the safety view, but focused on quality data.
Quality overview
Quality checklist completion by work unit
Top 5 checklist deficiencies
Quality issues raised by type
Quality observations raised by team member
Quality issues observed / hours worked
Positive vs. negative quality observations by company
Tasks
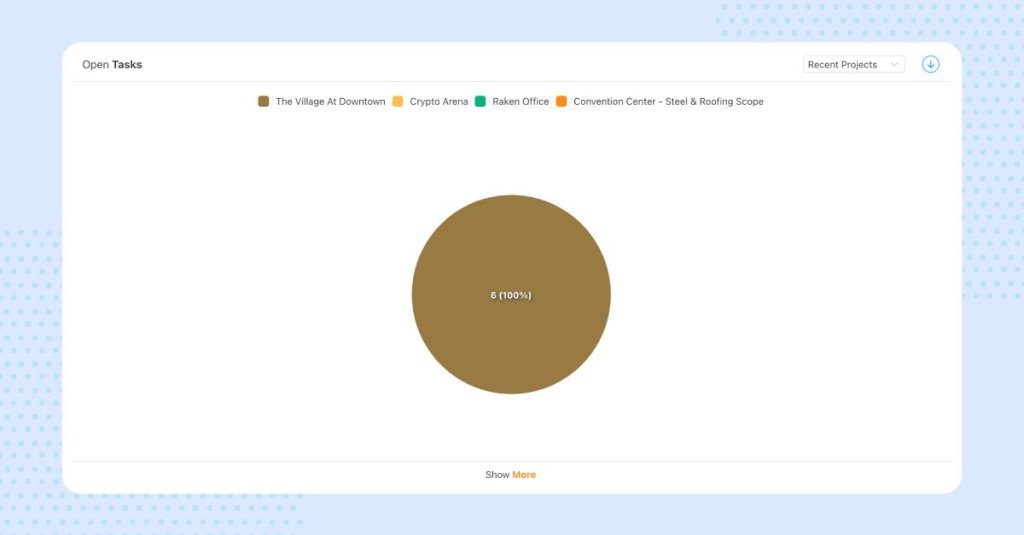
The tasks view is a chart showing all open tasks across projects.
How can I use this data?
Understand your capabilities
Raken’s insights dashboard shows you how your team works in detail. Accurately assess time and resource allocation to develop a thorough understanding of your capabilities and make more informed scheduling and hiring decisions for the next year or quarter.
Identify areas for improvement
Easily identify common deficiencies and compliance concerns without having to analyze data forum multiple projects manually. Implement strategies that target these issues directly.
Build better, more accurate bids
Gain an overarching view of performance across multiple projects to help you build more accurate bids and more confidently plan future projects based on real data.
See our support article on insights.
Some features may not be available with your plan - Check with our customer success team for more details.
